Most Americans will reach retirement with less money than they need. That’s not an opinion, I must say; it’s actually what the latest Federal Reserve data shows, cross-referenced with the contribution limits the IRS updated for 2026.
The national average for retirement savings is $333,940. That number is misleading. The median is what we must be looking at. This is the figure that represents the typical household, not the wealthiest — sits at just $87,000. The gap between the two reveals how a small share of high-balance savers pulls the average upward, while most households have accumulated far less than they’ll need.
The typical household: How much as it saved for retirement?
Fidelity Investments uses a widely cited rule of thumb:
- have one time your annual salary saved by 30
- three times by 40
- six times by 50
- eight times by 60
- and ten times by 67.
The reality is a whole different story: The median retirement savings
The median worker between 35 and 44 has $45,000 in retirement accounts. If that person earns $75,000 a year, Fidelity’s target for that age would be $225,000. That means the typical 40-year-old American has saved roughly one-fifth of where they should be.
The picture doesn’t improve with age. The median for people between 55 and 64 — on the doorstep of retirement — is $185,000. The “magic number” that Americans themselves say they need to retire comfortably in 2026 climbed to $1.46 million, according to a Northwestern Mutual survey. The distance between what people have and what they believe they need has never been more visible.
Why the average isn’t the number that matters
The $333,940 average exists because a handful of households with balances above $1 million pull the figure upward. According to the Federal Reserve, only 5% of households with retirement accounts have crossed that million-dollar threshold. Just 9.3% have $500,000 or more.
Comparing yourself to the median for your age group is more useful than measuring against the average. For those under 35, the median among people who have any savings at all is $18,880. In the 45-to-54 group, it reaches $115,000. The peak comes between 65 and 74, with a median of $200,000 — right before withdrawals start bringing balances down.
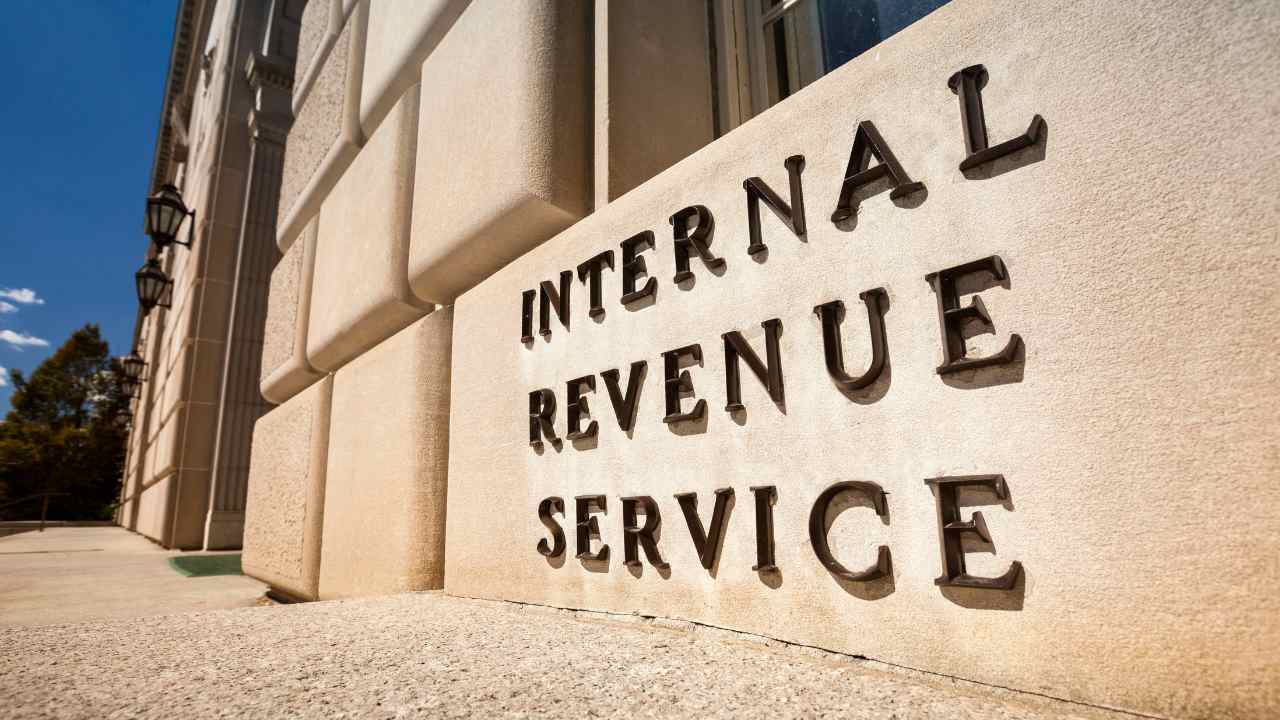
The 2026 limits open a real window for catching up
The IRS updated contribution limits for this year, and the difference from prior years is concrete. A worker under 50 can put up to $23,500 into a 401(k). Anyone 50 or older can reach $31,000 through the standard catch-up contribution.
But the most significant change — introduced by the SECURE 2.0 Act — applies to workers between 60 and 63. That specific group has access to a “super catch-up” that raises the total 401(k) limit to $35,750. Add a Roth IRA with an $8,600 limit for those over 50, and a worker in that age range can shelter nearly $44,000 a year from taxes.
When you claim Social Security changes the entire picture
Social Security doesn’t replace savings, but it reshapes the math considerably. The average benefit in 2026 is around $2,071 a month. The maximum for someone retiring at full retirement age reaches $4,152 per month.
The difference between claiming at 62 versus waiting until 70 is significant. Someone whose full retirement age benefit is $2,500 a month receives only $1,750 if they claim early. Waiting until 70 pushes that benefit to $3,100 a month. Over a 20-year retirement, holding out means collecting roughly $144,000 more.